PRTG Manual: Object Hierarchy
All objects in a PRTG monitoring configuration are arranged in a tree-like hierarchy to create an easy to navigate list and to give the user the possibility to arrange them in groups that monitor similar devices, services, or same locations. The hierarchical order described is also used to define common settings for larger groups of objects, for example settings of the Root group apply by default to all other objects below it (see section Inheritance of Settings).
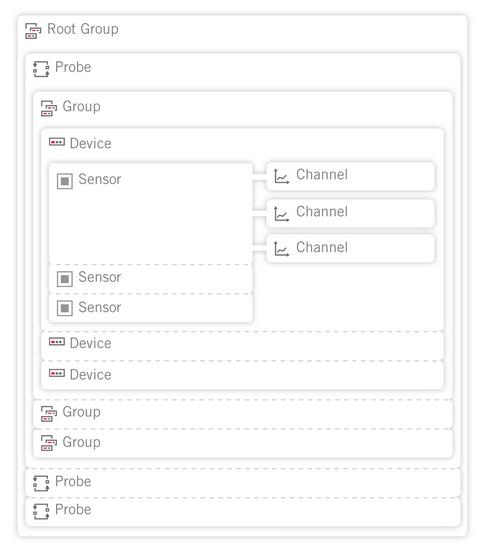
Object Hiearchy in PRTG
The Root group is the topmost instance in PRTG. It contains all other objects in your setup. Using the inheritance mechanism, we recommend adjusting the default settings for the Root group in order for all other objects to inherit them. This makes configuration easier later on.
Each group (except the Root group) is part of a Probe. This is the platform on which the monitoring takes place. All objects configured below a probe will be monitored via that probe. Every PRTG core installation automatically installs a Local Probe service. You can add additional probes and remote probes to your configuration to include remote devices from outside your network into the monitoring (see section Multiple Probes and Remote Probes). In a cluster, there is an additional Cluster Probe running on all nodes. Devices on the cluster probe are monitored by all nodes of the cluster, so data from different perspective is available and monitoring for these devices always continues, also if one of the nodes fails.
On each probe, there are one or more Groups, which serve merely structural purposes. Use groups to arrange similar objects in order to inherit same settings to them. To a group, you add the devices. You can arrange your devices in different nested groups to reflect the structure of your network.
Find below a sample configuration: A device tree with local probe, several groups, devices and their sensors.
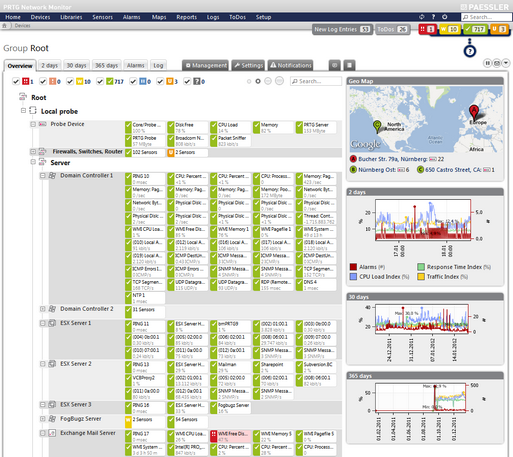
PRTG Device Tree View
To each probe or group, you can add Devices that you want to monitor. Each device in your PRTG configuration represents a real hardware device in your network. These can be, for example:
- Web or file server
- Client computer (Windows, Linux, or Mac OS)
- Router or network switch
- Almost every device in your network that has its own IP address
PRTG additionally adds a so called Probe Device to the local probe. This is an internal system device. It has access to the computer on which the probe is running on and monitors its health parameters with several sensors running on it.
On each device you can create a number of Sensors. Every sensor monitors one single aspect of a device. This can be, for example:
- One network service like SMTP, FTP, HTTP, etc.
- One network switch port's traffic
- CPU load of a device
- Memory load of a device
- Traffic of one network card
- One NetFlow device
- etc.
Every sensor has a number of Channels through which it receives the different data streams. The available channels depend on the type of sensor. One sensor channel can contain, for example:
- Downtime for a device
- Traffic in of a bandwidth device (e.g. a router)
- Traffic out of a bandwidth device (e.g. a router)
- Traffic sum of a bandwidth device (e.g. a router)
- WWW traffic of a NetFlow device
- Mail traffic of a NetFlow device
- Other traffic of a NetFlow device
- CPU Load of a device
- Loading time of a web page
- Download Bandwidth of a web page
- Time to first byte of a web page
- Response time of a Ping request to a device
- Response time of a Remote Desktop service
- etc.
Keywords: Object Hierarchy