

PRTG Manual: Architecture
PRTG Network Monitor consists of different parts which can be divided into three main categories: System parts, control interfaces and basic administration interfaces.
Type |
Part of PRTG |
System Parts |
Core Server |
Probe(s) |
|
User Interfaces |
Ajax Web Interface |
Enterprise Console |
|
Smart Phone Apps |
|
System Administration Programs |
PRTG Server Administrator |
PRTG Probe Administrator |
The core server is the heart of your PRTG system and performs the following processes:
- Configuration management for object monitoring
- Management and configuration of the connected probes
- Cluster management
- Database for monitoring results
- Notification management including a mail server for email delivery
- Report generator and scheduler
- User account management
- Data purging (culling data that is older than 365 days, for example)
- Web server and API server
In a cluster, the current master node is responsible for all of these tasks.
The built-in, fast and secure web server (no additional IIS or Apache is required) supports HTTP as well as secure HTTPS (via SSL). It serves the web interface when accessed with a browser and also answers PRTG Application Programming Interface (API) calls (e.g. for user scripts, or the Enterprise Console).
Note: Core server and probe(s) are configured as Windows services which are permanently run by the Windows system without the requirement for a logged-in user.
On a probe, the sensors created on a device perform the actual monitoring. The probe receives its configuration from the core server, runs the monitoring processes and delivers monitoring results back to the core server. On every system running a PRTG core server, there is always a local probe running with it.
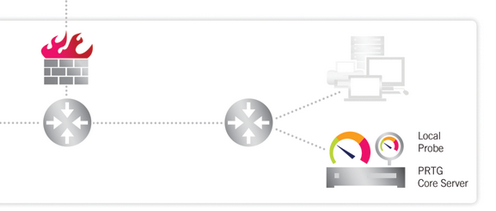
PRTG Core Server and Local Probe Monitoring a Local Area Network
The actual monitoring is performed by PRTG probe processes which run on one or more computers. During installation the so-called Local Probe is automatically created by the system. In a single-probe installation—which is the default setup—all monitoring is performed by the local probe.
The PRTG core server inside the corporate LAN (bottom right) is able to monitor services and servers in the entire Local Area Network (LAN). Note: Core server and probe(s) are configured as Windows services which are permanently run by the Windows system without the requirement for a logged-in user.
In a cluster setup, a cluster probe runs on all nodes. There is an additional so-called Cluster Probe. All devices created on it are monitored by all nodes in the cluster, so data from different perspectives is available and monitoring for these devices always continues, also if one of the nodes fails.
PRTG automatically monitors system health of its own core server and of each probe in order to discover overloading situations that may distort monitoring results. To monitor the system status of the probe computer, PRTG automatically creates a few sensors. These include Core/Probe Health, Cluster Probe Health, Disk Free, and a bandwidth sensor for all installed network cards. We recommend keeping these sensors, but you can optionally remove all except the Health sensors. They measure various internal system parameters of the probe system hardware and the probe's internal processes and then computes a resulting value. Frequent or repeated values below 100% should be investigated. Please check the sensor's channels for details.
Additional so-called Remote Probes can be created by the user in order to achieve monitoring of multiple locations, or for several other scenarios. They are using SSL-secured connections to the core and allow to securely monitor services and systems inside remote networks which are not openly accessible, or secured by firewalls. For more information please see Remote Probes and Multiple Probes section. For a video on this please see More section below.
Video Tutorial: There is a video available on the Paessler video tutorials page.
Keywords: Architecture,Architecture Basic Concept