

PRTG Manual: Maps
With PRTG's Maps feature (some people might call this 'dashboards') you can create web pages with up-to-the-minute monitoring status information in a customizable layout. Using this unique concept, you can also make your overview pages of live data publicly available, if you like.
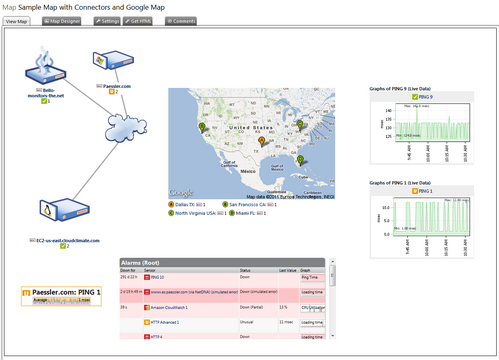
Example of a PRTG Map
In this section:
There are countless possibilities for the implementation of maps. For example, this feature can be used to:
- Create network maps with status icons for each device on the map.
- Create quick views of your network that can be shown on network operations center screens.
- Create a quick network overview for publishing on the Intranet, allowing at-a-glance information for management of other employees.
- Create a custom view of the most important sensors in your monitoring setup.
- Create Top 10 lists of the sensors of a specific group or device.
Technically, a map is a usual HTML web page. You can build a schema of your network by choosing from hundreds of device icons and connect them with lines. A map can consist of the following elements:
- A set of map items, which can include device icons, sensor status icons, graphs, data tables, lists of sensors, connection lines, geographical maps, or custom HTML code.
- An optional background image (a JPG, PNG, or GIF file, e.g. your company logo or a graphical view of your network).
You can also specify the size of the map. Using the AJAX-based map editor, you can place the items anywhere on the map and you can also change their size. Each map has a unique URL which can be used to link to the map. Users who want to access the map either need an account in your PRTG installation, or can access a public URL of the map if you allow the Public Access feature. Public maps contain a unique Map ID access key in the URL to block unwanted visitors.
Click the Maps entry from the main menu to view or add custom views of your network's status and monitoring data. Hover to show other menu items. Choose between:
- All
Calls the Maps feature where you can view or add custom views of your network's status and monitoring data. - Add Map
Lets you directly add a new map. - Select Map ›
Show existing maps. Hover to show other menu items. Follow the menu path (it is specific to your setup) to select a map.
In the All view, you see a list of all existing maps. Using the links next to a map name, you can perform the following actions.
- Click on the name of a map to view it.
- Delete: Delete this map.
- Clone: Create an exact copy of this map. As soon as you click, the map is cloned and the cloned map's settings are shown.
- Click on the Add Map button to add a new map.
Please see also Working with Table Lists. Additionally, there is multi-edit available. This enables you to change properties of several objects at a time. For more details, please see Multi-Edit Lists section.
To show several maps in a rotation, mark the desired maps using multi-edit and then select Map Rotation from the multi-edit menu.
While a map rotation is shown, you can change the refresh interval any time when hovering the arrows symbol in the lower right corner. Choose between 10, 30, or 60 seconds, 10 minutes or Refresh now.
For detailed information on how to create and edit maps, and to learn how to make them accessible to others, please see the following sections.
Ajax Web Interface—Advanced Procedures—Topics
Other Ajax Web Interface Sections
Related Topics |
Keywords: Maps,Configure,Configure Map,Maps,Maps automatic rotation