PRTG Manual: Toplists
Packet Sniffer and xFlow sensor types can not only measure the total bandwidth usage, they can also break down the traffic by IP address, port, protocol, and other parameters. The results are shown in so-called Toplists. This way PRTG is able to tell which IP address, connection, or protocol uses the most bandwidth. PRTG looks at all network packets (or streams) and collects the bandwidth information for all IPs, ports, and protocols. At the end of the toplist period, PRTG stores only the top entries of each list in its database.
Only Top Entries are Stored
Storing all available analysis data in a database during the analysis process would create a huge amount of data which would be very slow to transfer between probe and core and also retrieving data would be too slow. By storing only the top 100 entries for short periods of time it is possible to reduce the amount of data to a minimum while still being able to identify devices with huge bandwidth usage.
Pages of probes, groups, device, and sensors have a tab-like interface. Using the tabs you can navigate through various sub-pages of an object in order to show your network's status, view monitoring results, or change settings.
Tabs Bar on Sensor Pages
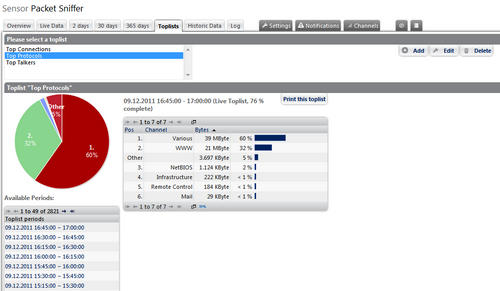
The Toplists tab is available for xFlow and Packet Sniffer sensors only. Click on the tab to open a toplist overview. By default, there are three different toplists predefined for each sensor:
- Top Connections: Shows bandwidth usage by connection.
- Top Protocols: Shows bandwidth usage by protocol.
- Top Talkers: Shows bandwidth usage by IP address.
Toplists for xFlow and Packet Sniffer Sensors
Click on one of these lists to view a distribution chart, and a list of source and destination IP and port, protocols, kind of traffic in different channels, etc. It depends on the selected list, which information is available. Click on an entry in the Available Periods lists on the left side to view data for a certain time span. By default, a time span of 15 minutes, and a top count of 100 is set. This means, for every list, you can view the top 100 measured in 15 minutes intervals.
In order to print a toplist, click on the Print this toplist button to view a printer-friendly version and then use the print option of your browser to send it to your printer.
Using the other buttons, you can add or delete new toplists, or edit existing ones.
Click on the Add button to create a new toplist. The available options are the same as for editing a list.
Select a toplist on the left and click on the Edit button to modify it.
Toplist Settings |
|
Name |
Enter a meaningful name to identify the toplist. |
Type |
|
Toplist is based on |
This setting is only available if a custom type is selected above. Select the fields you want to add to the toplist by adding a check mark in front of the respective field name. The available options depend on the type of sensor used. They're different for Packet Sniffer, NetFlow v5, v9, and sFlow. Note: For performance reasons, only select the field you really want to monitor. Please see Performance Considerations section below. |
Period (Minutes) |
Define the interval for the toplist in minutes. Please enter an integer value. Toplists always cover a certain time span. Once a time span has passed, the top results are stored and a new toplist is started. Note: In order to avoid load problems on your probe system, please do not set this interval too long. Default setting is 15 minutes. Please see Performance Considerations section below. |
Top Count |
Define the length of your toplist. Only this number of entries will be stored for each period. Please enter an integer value. Note: In order to avoid load problems on your probe system, please do not set this value as low as possible. Default setting is 100, in order to store the top 100 entries for each period. Please see Performance Considerations section below. |
Probe/Core Data Transfer |
Define how the probe sends the toplist dataset to the core server. Choose between:
For more information, please see Performance Considerations section below. |
Memory Limit (MB) |
Define the maximal amount of memory in MB the probe will use for collecting the different connection information. Every toplist adds its amount to the probe's memory consumption. Increase this value if the number of captured connections is not sufficient. Please enter an integer value. |
Click on the Save button to store your settings. If you change tabs or use the main menu, all changes to the settings will be lost!
Select a toplist on the left and click on the Delete button. Confirm with Yes to delete the list.
If you create toplists for data lines with considerable usage (e.g. steady bandwidth over 10 Mbit/s) or if the traffic is very diverse (i.e. many IPs/ports with only little traffic each) please consider the following aspects:
- The probe gathers all information needed for the toplist in RAM memory during each period. Only the top 100 entries are transferred to the core. Depending on the toplist type and traffic patterns the required memory can grow into many megabytes.
- Choose periods as short as desirable (especially important when traffic has a high level of diversity) to minimize memory usage.
- Memory requirements can grow almost exponentially with each field used in the toplists definition (depending on traffic pattern). Avoid complex toplists for high and diverse traffic. For example, Top Connections (5 fields) needs a lot more memory than Top Talkers (1 field).
- If you experience high bandwidth usage between core and probe try to choose the Wait until toplist period ends option.
- If you experience Data incomplete, memory limit was exceeded messages try to increase the memory limit in the toplist's settings but keep an eye on the probe process' memory usage.
- When working with toplists be aware that privacy issues can come up for certain configurations of this feature. Using toplists you can track all single connections of an individual PC to the outside world and you, as the administrator, must make sure that it is legal for you to configure PRTG like this.
- Keep in mind that toplists can be viewed through the web interface. You may not want to show lists of domains used in your network to others. So you should restrict access to sensor types having toplists.
Ajax Web Interface—Advanced Procedures—Topics
Other Ajax Web Interface Sections
Related Topics |
Keywords: Toplists,Flow,Flow Toplists,Packet Sniffing,Packet Sniffing Toplists